Implied Probability Calculators: Analyzing True Win Rates
 Available in US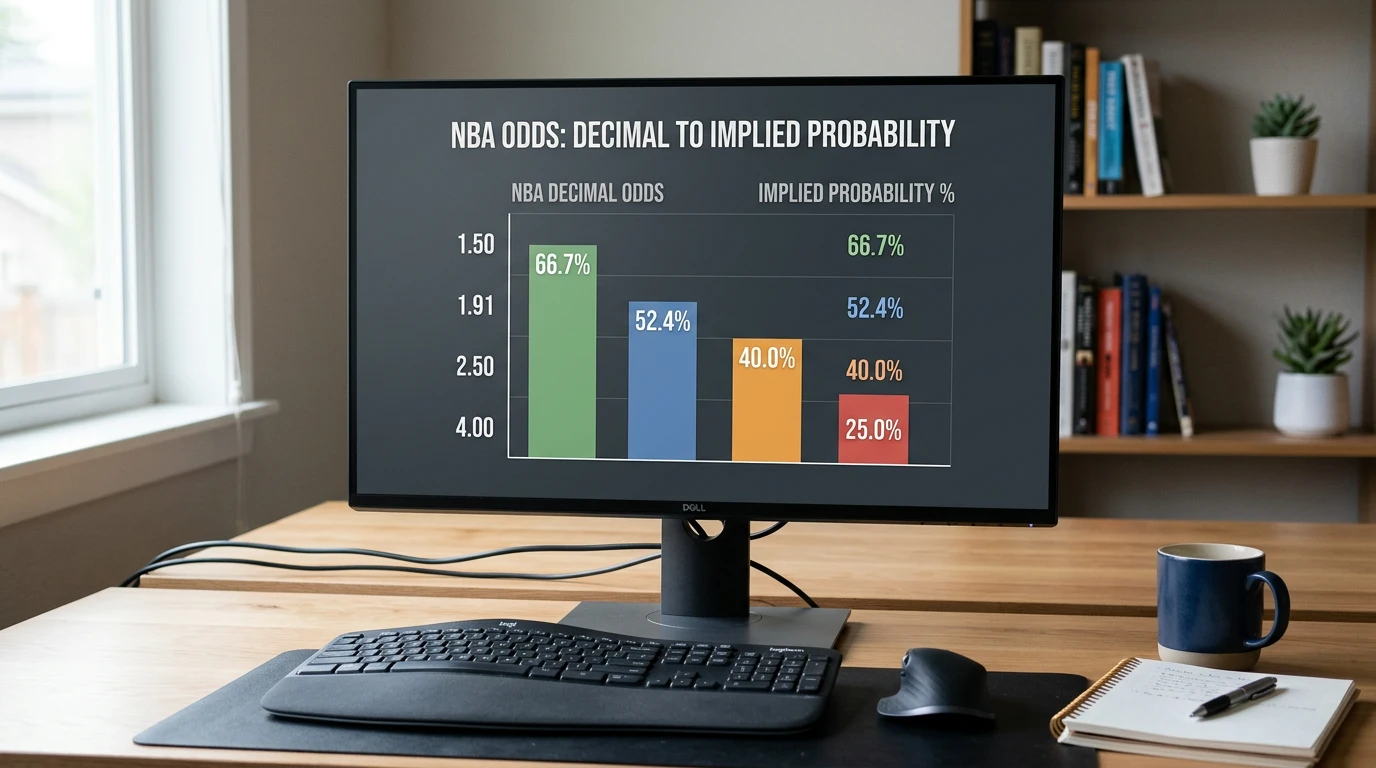
onverting Sportsbook Odds to Implied Probability
Here’s the most useful trick I’ve ever learned in NBA betting. Take any odds price – decimal, American, fractional – and convert it into a percentage. That percentage is the bookmaker’s quoted probability of the outcome happening, plus a hidden margin. Once you can do this in your head, every odds line becomes a probability statement, and the question shifts from “is this a good price?” to “is the bookmaker’s probability higher or lower than my own estimate?”
That’s the entire game. The price isn’t the bet – the price is just the bookmaker’s probability disguised as a number. Your job is to figure out where the bookmaker’s probability is wrong, by enough margin to overcome the hold, on a sample size big enough to matter.
UK punters increasingly need this skill because the variety of NBA markets keeps expanding. The handle on US sport – $147.9 billion legally bet in 2024, with basketball generating around 32% – is enormous, and the UK Q1 2025 online gambling sector grew 16% year-on-year on real-event betting. More markets, more prices, more places where probability mismatches hide. Knowing how to spot them is the punter’s edge.
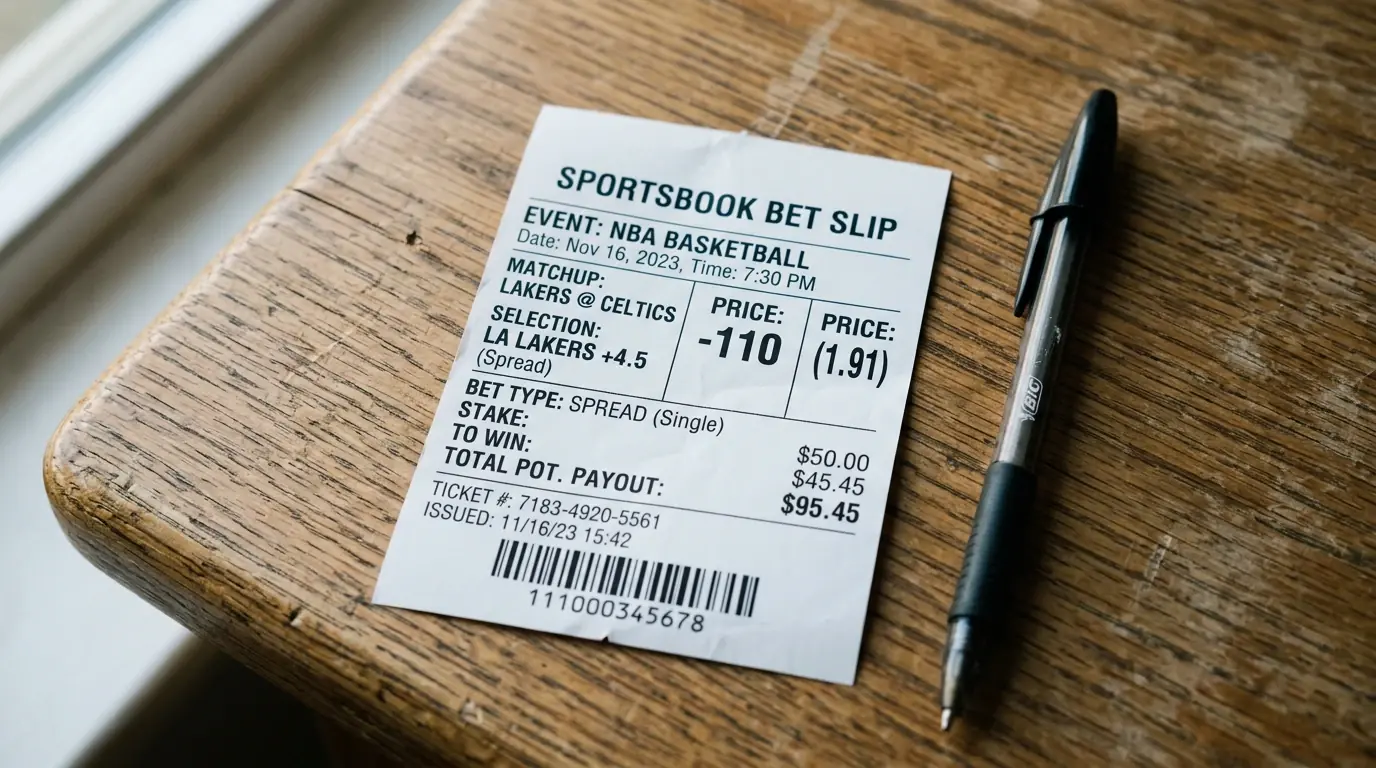
Once you know how to calculate win chances, it becomes much easier to understand what the standard -110 odds mean when placing a spread wager.
Decimal to Probability in One Step
Decimal odds make implied probability calculation almost trivial. Probability = 1 divided by decimal. That’s it.
So decimal of 1.91 implies a probability of 1/1.91 = 0.524, or 52.4%. Decimal of 2.50 implies a probability of 1/2.50 = 0.40, or 40%. Decimal of 4.00 implies a probability of 1/4.00 = 0.25, or 25%. Decimal of 1.50 implies a probability of 1/1.50 = 0.667, or 66.7%.
The mental shortcut for UK punters is to commit a few benchmarks to memory. 2.00 is a 50% market. 3.00 is a 33% market. 4.00 is a 25% market. 5.00 is a 20% market. Anything between 1.91 and 2.10 is roughly a coinflip. Anything around 1.50 is a strong favourite. Anything around 2.50 is a moderate underdog. With those anchors, you can read any decimal price as a percentage in under two seconds.
The number you calculate this way is called the “raw” implied probability. It includes the bookmaker’s margin. So it overstates the bookmaker’s actual estimate of the outcome. We’ll get to removing that margin shortly.
American Odds to Probability
American odds need two formulas because the maths differs for plus and minus prices. For minus numbers (favourites), implied probability = absolute value of the American number divided by (absolute value + 100). So −150 becomes 150/(150+100) = 150/250 = 0.60, or 60%.
For plus numbers (underdogs), implied probability = 100 divided by (American number + 100). So +200 becomes 100/(200+100) = 100/300 = 0.333, or 33.3%.
The standard NBA spread price of −110 implies 110/(110+100) = 110/210 = 0.5238, or 52.38%. That matches the decimal-derived figure for 1.91 (slight rounding difference). Both calculations are giving you the same answer in different clothing.
Once you’ve memorised the decimal benchmarks, the American conversion becomes a backup tool. If a US-facing podcast quotes +180 on an underdog and your UK book shows the same price as 2.80 in decimal, both convert to roughly 35.7% implied probability. The maths agrees. The numbers just look different.
Removing the Vig to Find a Fair Line
The raw implied probabilities you calculate from a two-way market always sum to more than 100%. That’s by design. The bookmaker’s margin lives in the overage. To find the fair-line probability – the bookmaker’s actual estimate stripped of the margin – you need to “devig” the market.
The simple two-way devig method is straightforward arithmetic. Take both sides’ raw implied probabilities and add them together. Then divide each side by that sum. The two normalised probabilities will sum to exactly 100% and represent the bookmaker’s best guess at the true win chance.
Worked example. NBA spread market: side A at 1.91, side B at 1.91. Raw probabilities: 52.4% and 52.4%. Sum: 104.8%. Side A’s fair probability = 52.4/104.8 = 50%. Side B’s fair probability = 50%. The market is treating both sides as a coinflip, with the 4.8% overage being the hold.
Asymmetric example. NBA total market: over at 1.85 (54.1% raw), under at 2.00 (50.0% raw). Sum: 104.1%. Over’s fair probability = 54.1/104.1 = 52.0%. Under’s fair probability = 50.0/104.1 = 48.0%. The market is leaning slightly toward the over, and that 4.1% overage is the bookmaker’s margin. With more than 130 international players in the league this season, the market is broadcasting daily probability estimates on hundreds of NBA games – knowing how to read them is the foundation of any analytical approach.
Using Probability to Spot Value
The mechanical work is the easy part. The hard part is having a probability estimate of your own that you can compare against the fair-line market probability. This is where the UK Gambling Commission’s chief executive Andrew Rhodes summarised the broader market shift well, telling regulators in early 2025: “Discussions with operators are showing a widening out of the sports offering in particular, with sports beyond the traditional horseracing and football growing in use, such as cricket, basketball, NFL and a host of other US-based sports.”
Find the most accurate odds conversions and betting tools on our premier basketball betting website.
That widening means more inefficient markets at the edges, but also more sharp money in the core. For an NBA punter to find value, your probability estimate needs to differ from the fair-line probability by at least the size of the bookmaker’s hold – usually 4-5% on standard markets, more on props.
The practical method I use: pick three or four NBA games per night that I’m confident about. Estimate my probability for each side based on power ratings, rest, injury news and pace. Calculate the bookmaker’s fair-line probability via devigging. If my estimate is more than 5 percentage points above the bookmaker’s, the bet is a candidate. If it’s only 2-3 percentage points above, I pass – the noise in my own model exceeds the edge.
Most UK punters skip this step entirely. They look at the price, decide whether they “like” the team, and bet. The probability framing turns it into a quantitative question, which is uncomfortable at first but produces better long-term results. The next step beyond simple two-way devigging – handling more complex three-way markets and accounting for asymmetric vig distribution – is covered in how to find no-vig fair odds for NBA bets.
What’s a fair ‘no-vig’ line on a typical NBA spread?
On a standard −110/−110 NBA spread, the bookmaker’s fair-line implied probability for each side is 50%, and the fair price is exactly 2.00 in decimal or +100 in American. The actual market price of 1.91 (or −110) builds in roughly 4.55% bookmaker hold – that’s the gap between the fair price and the offered price. On asymmetric prices like −115/−105, the fair-line probability skews slightly: the −115 side has a higher fair probability than the −105 side, but the gap is small.
How do I compare implied probability across two UK books?
Calculate the fair-line probability separately at each book using the same devigging method, then compare the two fair-line numbers. If book A’s fair-line probability for the over is 51% and book B’s is 53%, the books disagree on the underlying probability, not just the margin. The book with the longer price for the over (lower fair probability) is the one to back if you think the over is more likely than 53%, because you’re getting a slightly better price after accounting for hold. This is the core mechanic of line shopping.
Written by the editors at how Does nba Betting Work.