No-Vig Fair Odds for NBA Bets: How to Devig a Two-Way Market
 Available in US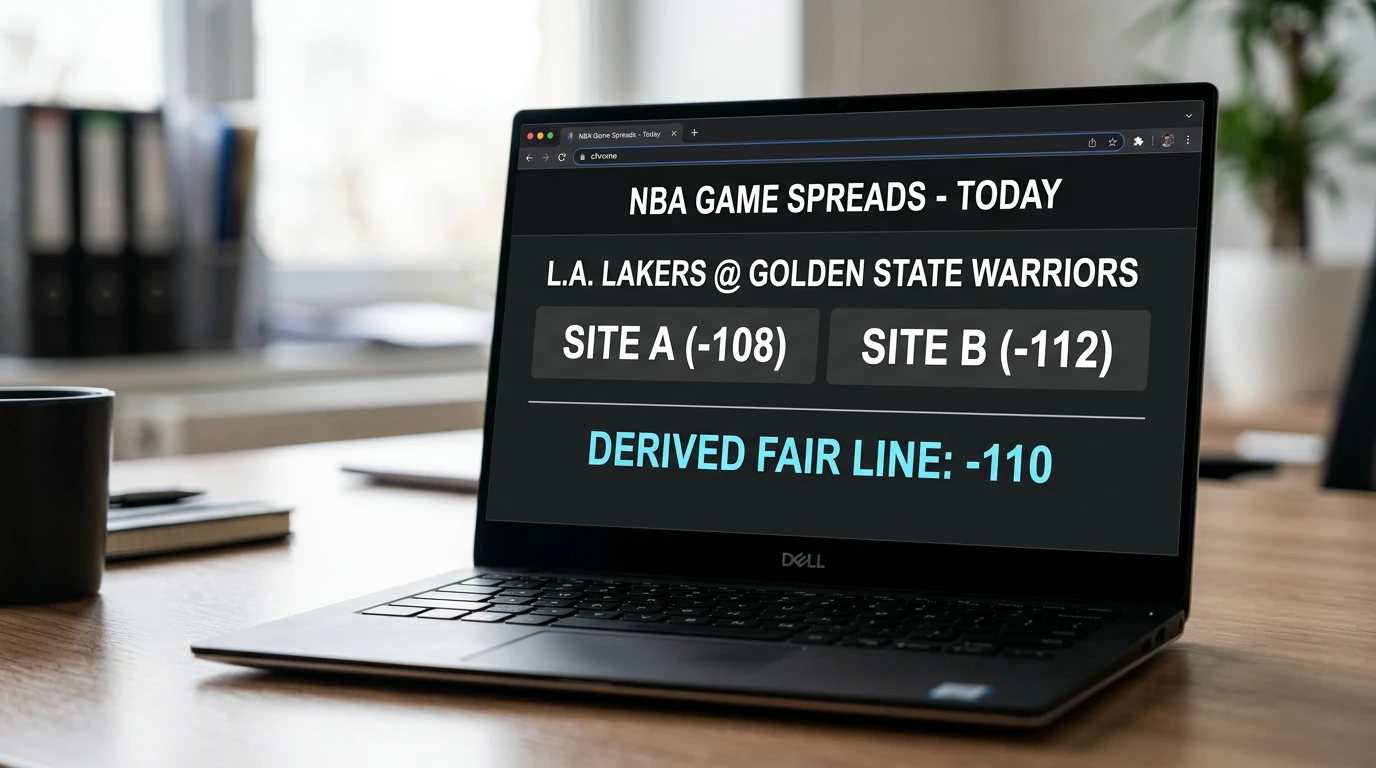
Why a “No-Vig” Number Matters
I keep a tab open in my browser on game nights with a five-line devigging calculator I built years ago. Type in the two sides of any NBA market, get out the no-vig probabilities. It looks like the dullest spreadsheet on earth. It’s also the single most useful tool I own as a UK NBA punter.
The reason is simple. The price you see on a UK bet slip is not the bookmaker’s actual probability estimate. It’s the bookmaker’s probability plus a hidden margin. A no-vig calculation strips out the margin and shows you the underlying number – what the book actually thinks will happen, before they’ve added their cut. That stripped-down number is the only thing you should compare your own probability estimates against.
The UK General Betting Duty grew to £714 million in fiscal year 2024-25, up from £654 million the year before. That growth is happening in a market where the standard NBA spread carries a 4.55% margin and the standard prop carries 7-10%. Every penny of that margin is the punter paying a tax on convenience. Devigging is how you see through the tax to the underlying number.
Devigging a Two-Way NBA Market
The two-way devig is the workhorse calculation for NBA bettors because almost every primary market – moneyline, spread, total – is a binary outcome. One side or the other. No third option.
The method has three steps. First, calculate the raw implied probability of each side using 1 divided by decimal. Second, add the two raw probabilities together – they’ll sum to something above 100%, with the overage being the hold. Third, divide each raw probability by the sum to get the normalised, no-vig probability. The two normalised numbers will sum to exactly 100%.
The arithmetic doesn’t care about the sport. It works on any two-way market in any sport. What’s NBA-specific is the typical hold range. Spread and total markets at most UK books carry 4-5% hold. Moneyline markets on close games carry 4-5% hold; on heavy favourites where one side is priced very short, the hold can stretch toward 6-8%. Props run wider – 7-10% is normal, and alternate prop lines can be 12% or more.
Knowing the typical hold range is your sanity check. If you devig a market and it tells you the bookmaker’s fair-line probability for one side is 65%, but the spread of −7 typically implies closer to 55%, you’ve made an arithmetic error somewhere. Walk through the calculation again before you stake anything.
Are There Three-Way NBA Markets?
The NBA, unlike football, has almost no three-way markets in the UK book. Basketball games can’t end in a regulation tie – overtime ensures a winner. So the moneyline is always two-way: home win, or away win, including overtime.
The exception is regulation-only markets. Some UK books offer a “regulation moneyline” where the three outcomes are home win in regulation, draw at end of regulation (forcing overtime), away win in regulation. The draw branch is the small middle, usually priced around 9.00 to 12.00 in decimal, reflecting the ~6-9% probability of a tie at the end of the fourth quarter.
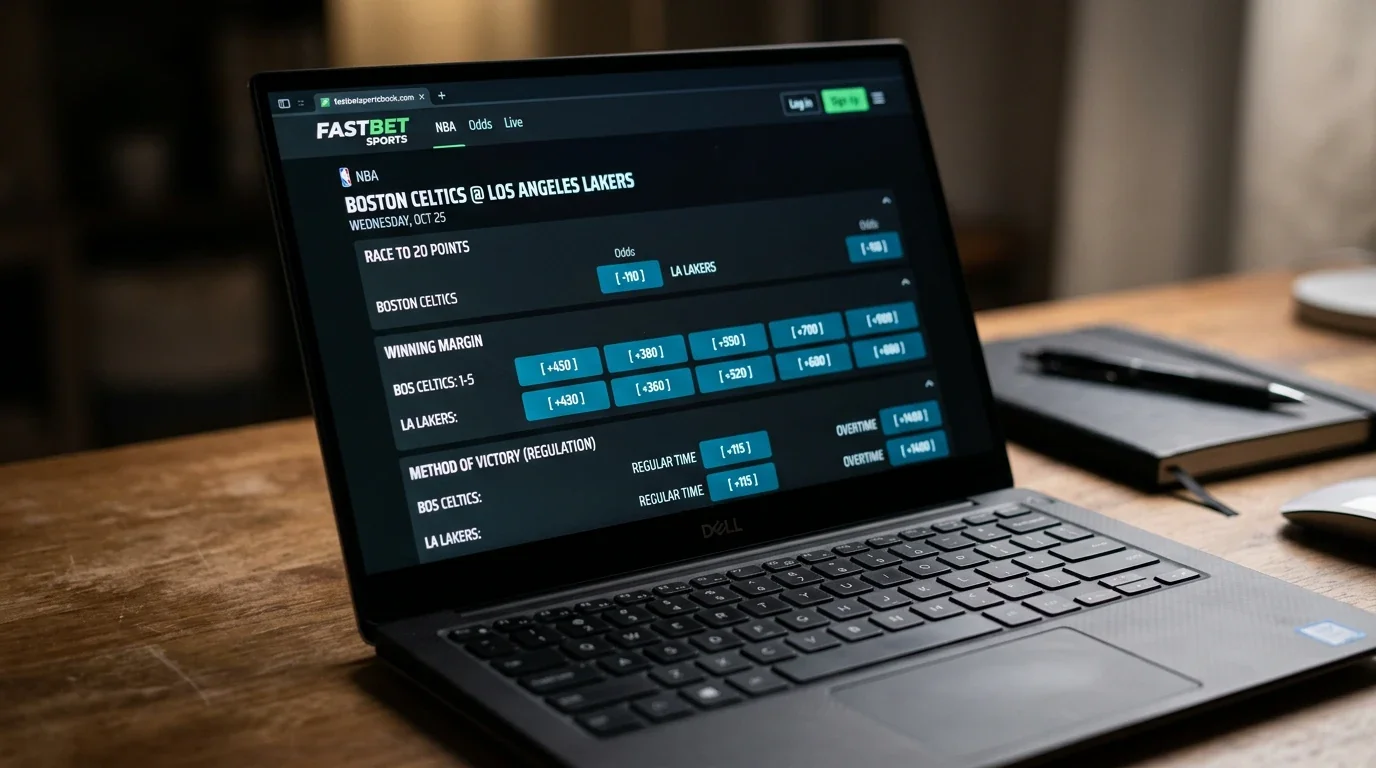
Devigging a three-way market follows the same logic as two-way, but with three terms. Calculate raw probabilities for all three outcomes, sum them, divide each by the sum to normalise. The hold tends to be larger on three-way markets – 6-8% rather than 4-5% – because the additional variable adds risk for the bookmaker. UK punters mostly encounter three-way devigging on prop variants like “method of victory” with separate buckets for regulation and overtime, rather than on standard moneyline markets.
Worked Example: A Spread at −108/−112
Let’s walk through a real example with asymmetric pricing. Suppose Boston −7 is priced at 1.93 in decimal (American −108) and the underdog at +7 is priced at 1.89 (American −112). The book is shading the price toward the underdog side because the public is heavier on Boston.
Step one: raw implied probabilities. Boston −7 at 1.93 implies 1/1.93 = 51.81%. Underdog +7 at 1.89 implies 1/1.89 = 52.91%. Sum: 104.72%. The hold is 4.72%.
Step two: normalise. Boston’s fair probability = 51.81/104.72 = 49.47%. Underdog’s fair probability = 52.91/104.72 = 50.53%. The market is telling you that, after stripping the margin, the bookmaker thinks the underdog has a 50.53% chance to cover the +7 spread – slightly better than coinflip, marginally favoured.
Why does this matter? Because if you build your own model and conclude that Boston should cover at 53%, the gap between your estimate (53%) and the bookmaker’s fair-line estimate (49.47%) is 3.53 percentage points. That’s a real edge – but only if your model is right. The 4.72% hold means the offered price for Boston implies just 51.81% raw, so you need your true probability to exceed 51.81% to break even. Your 53% estimate beats that threshold by 1.19 percentage points. That’s a thin edge, but it’s an edge.
This is the discipline that separates serious NBA punters from casual ones. Calculate the fair line. Compare to your estimate. Bet only when the gap is comfortably above the noise in your own model. If you’re not sure whether your model has 1% accuracy or 5% accuracy, the only honest answer is to demand a bigger gap before staking.
The Limits of No-Vig Modelling
Devigging assumes the bookmaker’s fair line is roughly correct after the margin is stripped out. That assumption holds well on liquid, sharp markets. It holds less well on illiquid, soft markets.
The standard NBA spread on a Monday-night Lakers game has six-figure handle through it before tip-off. The market is sharp. Devigging that price gives you a probability estimate within 1% of the true number, on average. The standard NBA prop on a third-string forward’s points line has barely a four-figure handle. The market is soft. Devigging that price might be 3-5% off the true number, with the error skewing in unpredictable directions.
The other limit is that devigging only tells you what the bookmaker thinks. It doesn’t tell you whether the bookmaker is right. A sharp UK punter develops their own probability estimates from underlying inputs – pace, defensive rating, injury status, rotation patterns – and uses devigging only as the comparison benchmark. The 13.5 million active accounts at the largest UK online operators in early 2025 mean a lot of action goes through these markets, but most of it is recreational and doesn’t move prices the way sharp money does.
Use devigging as a tool, not a truth. It’s the second step in a pricing analysis, not the first. The first step is your own read of the game. The metric that actually measures whether your reads have edge over the long run is closing line value, walked through in detail in the CLV guide for NBA bettors.
Does no-vig work for live NBA markets?
The mechanics work the same way on a live market: raw probabilities, sum, normalise. But the hold on live NBA markets is wider than pre-game – typically 6-10% rather than 4-5% – because the bookmaker is pricing under time pressure and assumes more model risk. So the fair-line probabilities you calculate live are slightly less reliable, and the gap you need between your estimate and the fair line should be wider before you stake. Live devigging is also harder because prices change every few seconds, so you’re working with a moving target.
Why are NBA prop devigs less reliable than spreads?
Three reasons. First, prop markets carry wider holds – 7-10% versus 4-5% on spreads – so the bookmaker has more cushion to be wrong without losing money. Second, prop volumes are smaller, so the line moves less and the price reflects less collective wisdom. Third, prop markets often run alongside related correlated bets that the book has to balance internally, which can distort the visible price. The result: a devigged prop line is a starting point, not an endpoint. Your own probability model matters more on props than on spreads, where the market does most of the work for you.
Prepared by the how Does nba Betting Work editorial staff.