NBA Threes-Made Props: Volume, Percentage and Lineup Spacing
 Available in US
The Highest-Variance Prop on the Slate
Last March I watched a punter on a UK forum lose his composure over a 3.5 threes line on a guard who finished the night with two. The player had taken eleven attempts. Eleven. He just missed nine of them. The bettor was furious – and entirely wrong about what he had bought.
Threes-made props are the most volatile player market in basketball, and that’s not a quirk – it’s the structural nature of the bet. A 35% three-point shooter taking eight attempts has a roughly 30% chance of going under 2.5 makes on a normal distribution. The same shooter on a hot night clears 4.5. Same player, same minutes, same role. That’s the shooter’s natural variance, and the line can’t iron it out.
The NBA’s UK profile keeps growing – 170 million viewers across the 2025-26 season, an 86% jump from the prior year, plus 1.3 billion watch hours globally. More eyes mean tighter pricing on the obvious markets: spreads, totals, points props on the headline names. Threes-made props are where the squishiness still lives, and where I do most of my prop work. The trick isn’t picking the hot-hand night. The trick is understanding what the line is actually charging for, and where it underprices volume against a shooter’s percentage.
Mark Tatum, the NBA’s deputy commissioner, told TalkSport ahead of the London game that “the top-tier teams are coming over to the UK and our partners are doing a wonderful job,” and the broadcast schedule reflects that. UK punters now see more West Coast late-window starts than ever, and the live three-point markets that open after the first quarter are part of why I built a separate process for this prop in the first place.
Volume vs Percentage
The single biggest mistake I see in threes-made handicapping is treating attempts and percentages as interchangeable inputs. They aren’t. Volume is the floor of the prop. Percentage is the ceiling.
Here’s the maths nobody walks through. A shooter who averages 8.0 three-point attempts at a 36% clip has an expected value of 2.88 makes per game. A different shooter at 6.0 attempts and 42% has an expected value of 2.52. The first player has a higher mean, but the distribution shapes are different. The high-volume shooter has a fatter right tail – more 4-make and 5-make games – but also a fatter left tail of 0s and 1s. The high-percentage low-volume shooter clusters around 2-3 with fewer extremes.
When the line on both is set at 2.5, those are very different bets. I lean over on the volume shooter because the right tail pays the same as the middle. I lean under on the percentage shooter when the line moves to 2.5 because their distribution is bunched right at the line, and “exactly 2” is a real settlement risk.
Pace matters here too. A team running 102 possessions per game versus 96 isn’t a 6% volume bump for its shooters – it’s compounded by the fact that more possessions usually means more transition threes, which are higher-percentage looks. The pace adjustment on threes-made props is the single most underpriced factor I track. UK books often pull lines from US providers without re-adjusting for the matchup pace, and that’s where I get my edges.
One concrete example. In a recent game I had a shooter at a 2.5 line, US opening price -115 over. His season volume was 7.8 attempts at 38%, expected value 2.96. The opponent allowed 39 three-point attempts per game, the third-highest mark in the league. I had the projection at 8.6 attempts, percentage held at 38%, expected value 3.27. The over hit at 4 makes. That’s not a sharp read – it’s just refusing to ignore one input.
Role, Lineup and Spacing
A shooter’s three-point profile isn’t a player stat. It’s a lineup stat. The same player in two different five-man units puts up wildly different numbers, and the props line rarely catches up fast enough.
The cleanest example: a wing playing alongside a non-shooting big and a non-shooting point guard sees defenders sag off, gets fewer clean catch-and-shoot looks, and his three-point volume drops. Move the same wing into a unit with two floor-spacers around a star creator, and the catch-and-shoot rate doubles. I’ve seen 30% swings in three-point attempts game to game purely from the starting big sitting out and a stretch four taking those minutes.
This is where the contour of how player props work in the UK market intersects with lineup data in a way that pre-game projections often miss. Books price the player. Punters who track lineups price the unit. The gap is real and it survives.
Off-ball role is another lever. A shooter coming off three down screens per game versus eight gets a different shot diet entirely. The eight-screen shooter is a movement gunner who shoots contested off the catch – lower percentage, higher volume. The three-screen shooter is more of a relocation guy who shoots off ball reversal – higher percentage, lower volume. Both can hit 2.5, but the over plays differently. Movement shooters need the game to stay close so they keep getting opportunities. Relocation shooters need the team to keep generating drive-and-kick possessions. When I see a relocation shooter face a team that switches everything and kills paint penetration, I’m shading hard towards under regardless of what his season averages say.
Defensive Matchup Effects
Defensive three-point rates are the most misunderstood team stat in basketball. The number every UK book displays is “opponent three-point percentage,” and most of that is noise. What I actually track is opponent three-point attempts allowed and the location split between corner and above-the-break.
A team that allows 41 three-point attempts per game is giving up volume – and threes-made props are a volume bet first. A team that allows 32 attempts is denying the look entirely, often by switching aggressively or staying home on shooters. The percentage allowed on those attempts varies year to year and is mostly luck. The volume allowed is structural and sticks.
Shot location matters within that volume. Corner threes go in at roughly 40% league-wide. Above-the-break threes hover around 36%. A team that funnels opponents into above-the-break attempts but locks down the corners is creating a lower expected value on threes-made props than the headline volume number suggests.
Then there’s the closeout speed factor. Some defences run a hard closeout scheme – they sprint at shooters and challenge every catch. That depresses three-point percentage but doesn’t change attempts much. Other teams play a soft drop scheme – they protect the rim and concede catch-and-shoot looks. That inflates both attempts and percentage. The drop teams are gold for over bets on volume shooters. Hard-closeout teams are where I look for under spots on movement shooters whose game depends on getting clean releases.
I also flag pace mismatches separately. A team playing 96 possessions against an opponent who plays 104 averages 100 possessions in their head-to-head – but that maths only holds for road teams. Home pace bias adds another wrinkle, and on threes-made props it’s worth two-tenths of an attempt either way.
The “Hot Hand” Bias in Pricing
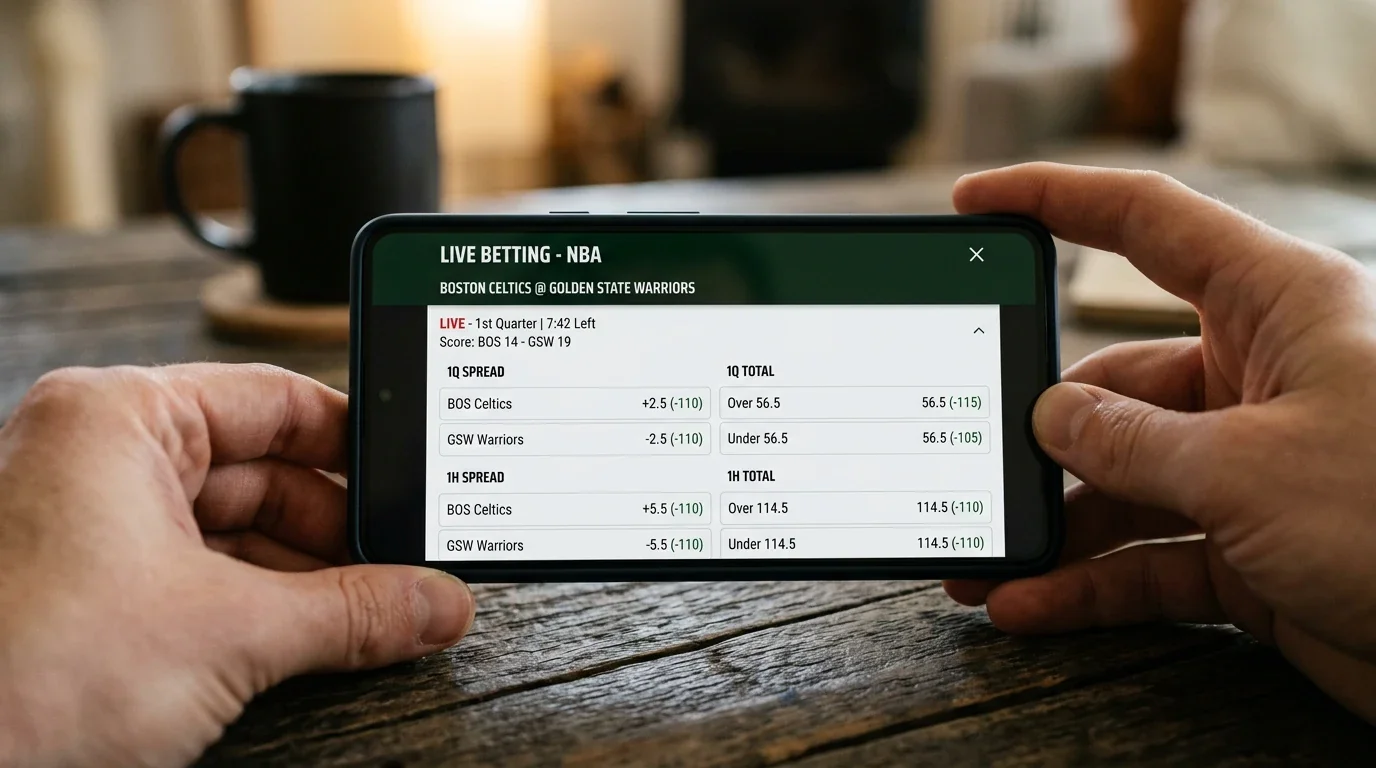
Live threes-made markets are riddled with hot-hand bias, and it’s the cleanest exploit I run on UK books. After a shooter hits his first two threes, the live line on his total moves up roughly half a make beyond what the underlying probability supports. After he misses his first three attempts, the live line drops too far the other way.
The academic literature on the hot hand is split – some studies find a small genuine effect, others find none. What everyone agrees on is that bettors over-react to streaks more than the actual streaks justify. Live books price to where the action is, not to the truth, and that’s where the lean lives.
My practical rule: when a shooter goes 2-of-3 in the first quarter, I look at the live line on his total threes. If his pre-game line was 2.5 and the live line is now 4.5 with the under priced at -130 or worse, I take the under. The base rate of finishing with five or more threes after a 2-for-3 first quarter isn’t 60%, even on a hot night. It’s closer to 40%. The market overshoots.
The reverse exploit also works but pays less. When a shooter goes 0-for-4 in the first quarter and the live line drops to 1.5 with the over at +110 or longer, the historical hit rate on cold-start finishes is around 50%. The market under-prices the regression. Volume continues even when the percentage hasn’t yet, and these are the games where you watch a player finish 3-of-12 and clear the under-2.5 anyway.
Real-event in-play GGY in the UK rose 16% year-on-year last quarter, which tells you live betting volume is climbing fast, and the UK books are leaning more into in-play pricing as the headline acquisition channel. More live volume doesn’t make the lines sharper – it makes the action thicker, and the recreational money piling on a hot first quarter is what creates the fade spot.
Building a Threes-Made Process That Survives Variance
The reason most punters quit threes-made props after six weeks isn’t the maths. It’s the variance. Even a true 10% edge on a single bet has a wide enough distribution that you can lose four in a row without doing anything wrong, and most people interpret that as a broken model. They quit at the worst possible moment.
The fix is a sample-size mindset. I don’t grade an individual threes-made bet on the result. I grade it on the inputs: was the volume projection in the right zone, did the percentage assumption survive the matchup, was the line actually mispriced relative to my number. If all three were yes and the bet lost, I shrug and log it. If two were no and the bet won, I flag it as a fluke and don’t repeat the process.
The other thing I track is line-shopping value on this market specifically. UK book disagreement on threes-made lines is wider than on points props because there’s less sharp money policing the price. Half-make differences across two operators show up regularly, and that half-make is the difference between a 52% bet and a 56% bet at the same odds. Over a season, that compounds into the entire edge.
Threes-made is a market I’d rather skip on a quiet night than force. Some matchups don’t have a clear lean – the shooter’s volume, percentage, lineup, defence and pace all sit in normal ranges, the line is fair, and there’s nothing to bet. The discipline to walk away from those is what separates a profitable book from a noisy one. The high-variance markets reward patience harder than anything else on the slate.
Should I bet attempts or makes when the line is offered?
Bet makes lines for value when volume is the dominant input – high-attempt shooters whose distribution has a fat right tail. Bet attempts lines, where offered, when you’re more confident about role and pace than about the shooter’s percentage that night. The two markets pay differently and don’t always agree, so always cross-check.
Why do threes-made props swing the most late in games?
Late-game offence in close contests skews towards three-point attempts because trailing teams need points faster, and even leading teams milk the clock with high-value possessions. Garbage time produces another bump when bench shooters get loose minutes. The combination means the final five minutes of regulation can deliver a third of a shooter’s attempts on a tight night.
Prepared by the how Does nba Betting Work editorial staff.