NBA Rebounds Props: Matchup Trees, Minutes and Volatility
 Available in US
Why Rebounds Move More Than Points
The first time I tracked rebound props for a full month, I was shocked. The same player whose points prop landed within two of the line on most nights would land four or five rebounds away from the line on the same nights. Rebounds are inherently more volatile than points, and the volatility is structural – built into how rebounds get distributed across a roster.
That extra volatility has two sources. First, rebounds depend on missed shots, and missed shots are random in ways that made shots aren’t. A team that shoots well leaves fewer rebounds available for everyone on the floor, including the opponent. Second, rebounds are competed for in real time. Whoever happens to be in the right spot when the shot misses gets the board. Position luck on three or four key plays per game can swing a rebound prop by 20%.
That said, rebounds are very readable for punters who do the matchup work. With the 2025-26 NBA season pulling in 170 million viewers across US broadcasts and 13.5 million active accounts at the largest UK online operators in early 2025, prop volume is enormous and the lines on big-man rebound props get sharpened daily. The edges live in the smaller games, the back-to-back matchups, and the days when injury news scrambles the rotation.
Total Rebound Rate vs Team Rate
Total rebound rate is the percentage of available rebounds a player grabs while on the floor. A high-rebound centre might sit at 18-22%. A wing forward might sit at 8-12%. The number is publicly tracked and stable across most seasons.
The trap is treating rebound rate as the only input. A 20% rebound-rate centre will get more boards on a night when his opponent shoots 40% from the field (lots of misses) than on a night when his opponent shoots 52% (few misses). The same rebound rate, applied to a different missed-shot pool, produces wildly different totals.
Team rebound rate matters too. A team that grabs 75% of available rebounds doesn’t leave many for opponents to scoop. A team that grabs 65% leaves more on the table. So the same individual centre might get 12 boards in a game against a weak rebounding team and 7 against a strong one, even if the missed-shot pool is identical. The practical model is: estimate missed-shot pool, multiply by the player’s team’s rebound share against that opponent’s offensive rebounding rate, multiply by the player’s individual rebound rate within his team.
The Matchup Tree
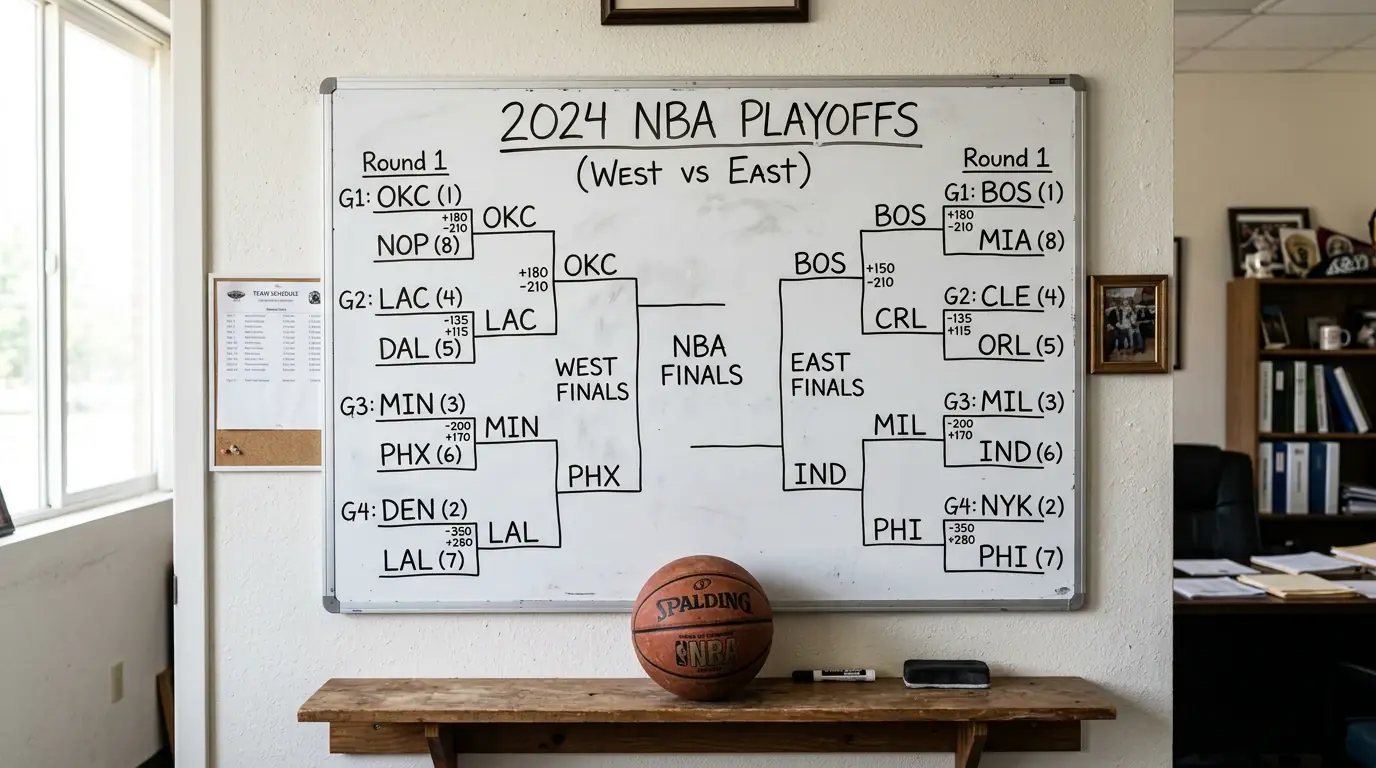
I learned to draw a matchup tree on a whiteboard in 2019 and I’ve used it on every rebounds prop since. The tree has four branches: opponent’s shooting profile, opponent’s offensive rebounding rate, the matchup at the centre position specifically, and the projected pace.
Opponent shooting profile: a team that takes lots of three-pointers misses lots of them long, which generates more long rebounds and benefits perimeter rebounders. A team that lives in the paint generates short rebounds and benefits the centre. Match the player you’re propping to the opponent’s shot diet. A wing forward propping over rebounds gets a boost against three-heavy opponents. A centre propping over gets a boost against paint-heavy opponents.
Opponent’s offensive rebounding rate: a team that crashes the boards aggressively will steal back its own misses. That suppresses defensive rebound numbers for the player you’re propping. Opponents that drop back on defence after a missed shot leave more boards available, inflating defensive rebound numbers.
The centre matchup: when two top-tier centres meet, both rebound numbers usually come in below their season averages because they cancel each other out. When one elite centre meets a journeyman backup, the elite centre typically rebounds at his ceiling and the backup at his floor. Pace ties it together – slow games have fewer possessions, fewer shots, fewer misses, fewer rebounds for everyone. The next prop family up the volatility scale is assists, which are even more sensitive to lineup composition – covered in how to read NBA assists props for UK punters.
Pace and Opponent Missed Shots
Pace and opponent shooting profile are the two biggest drivers of total available rebounds. They feed into each other but they’re separate variables, and treating them as one input is a common amateur mistake.
A high-pace game generates more possessions, more shots, more misses, more rebound opportunities. But high-pace games are often shooting-heavy, which means a slightly higher field goal percentage and fewer rebounds per possession. The two effects partially cancel. The net result for total available rebounds is usually a small positive in fast games, not the big positive that pace alone would suggest.
The opponent’s expected field goal percentage is the cleaner input. If the opponent typically shoots 47% from the field but is facing a top-five defence tonight, expect them to shoot 43-45%. That’s 2-4 percentage points more missed shots, which translates to roughly 2-3 additional rebounds on the floor across the game. If your player has a 20% rebound rate, those extra missed shots add about half a rebound to his projected line.
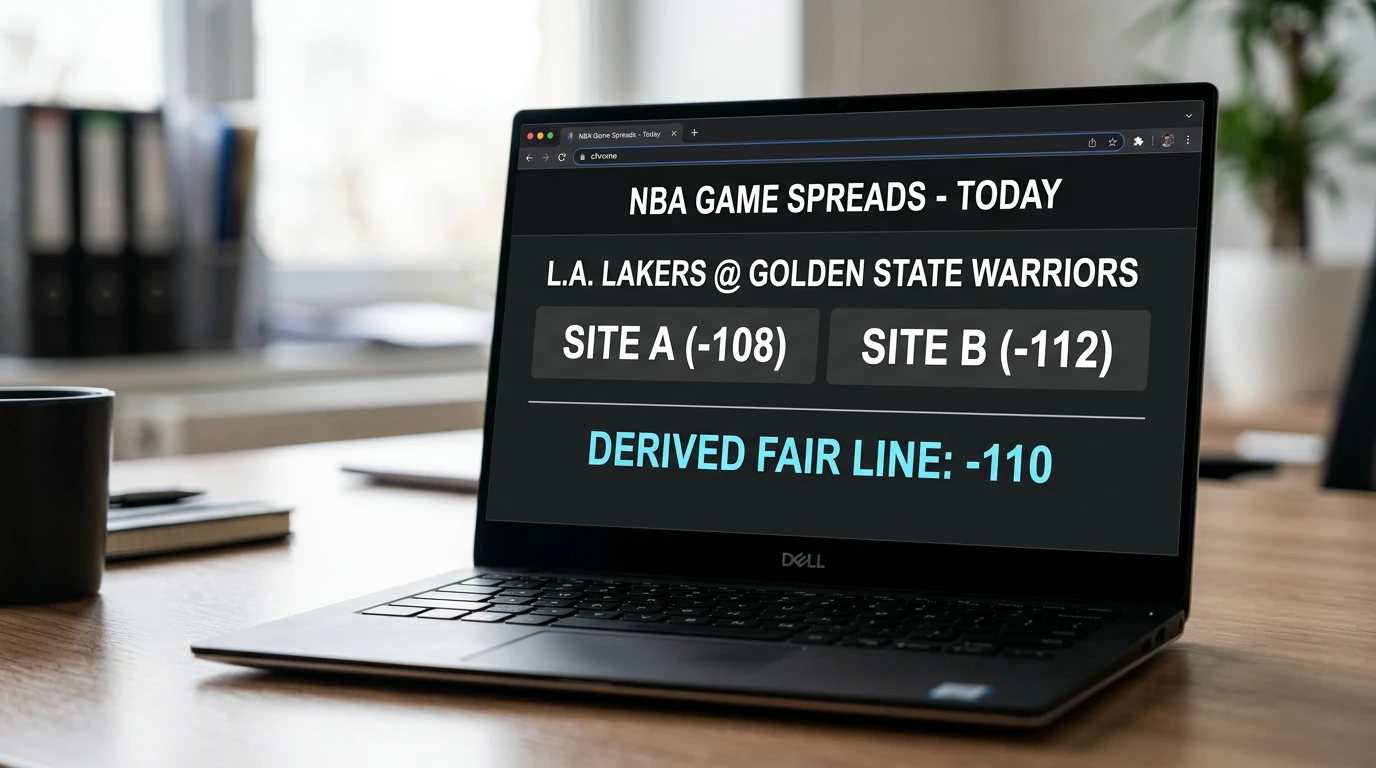
The implication: when a UK book hangs the same rebound line on a player regardless of opponent, you have an edge. Books usually do adjust for opponent, but not always perfectly, especially on smaller games where the trader’s attention is elsewhere.
Minute Variance and Foul Risk
Minutes are the pure multiplier on every prop. A centre who plays 32 minutes generates more rebound opportunities than the same centre playing 24 minutes. Foul trouble is the most common reason minutes get cut short.
Big men accumulate fouls faster than guards because the rebounding battles in the paint are physical. A centre who picks up two fouls in the first quarter is often pulled and held until the second half. That’s a 5-8 minute reduction in playing time on top of whatever damage the early absence does to his rhythm. For a rebound prop, those lost minutes typically cost 2-3 boards.
Back-to-back games are the other minute compressor. Teams on the second night often have their starters’ minutes capped at 28-30 for rest management, especially the ageing veterans. If the book hung the rebound prop based on the player’s average 35 minutes and the coach has decided this is a 28-minute night, you’ve got a structural under that the market may not have priced in yet. Watch the official injury report and the coach’s pre-game comments – sometimes the cap is announced an hour before tip-off and the line hasn’t moved.
Are guards’ rebound props softer than centres’?
Yes, in the sense that they’re less precisely modelled. Centres are the primary rebounders for almost every team, so books focus their pricing attention there and the lines are sharp. Guards’ rebound props sit at 3.5 or 4.5 most nights, with low juice and low volume. The trader is paying less attention. Soft pockets show up more often on guard rebound props, especially on point guards in fast-paced games where their boards spike unexpectedly. The catch is the absolute size of the edge is smaller because the prop line itself is small.
Do offensive rebounds count toward total in UK books?
Yes, the standard NBA rebound prop in UK books counts both offensive and defensive rebounds in the player’s total. The settlement is the player’s official rebound figure as reported by the league after the game. Some books also offer separate offensive-rebound-only and defensive-rebound-only props for big men, with smaller numbers and longer prices. The total rebound prop is the primary market by volume; the offensive-only and defensive-only variants are niche markets that sometimes carry softer pricing because they trade less.
Prepared by the how Does nba Betting Work editorial staff.